Data visualization startup Virtualitics lands $37M investment
Many companies grapple with data challenges. In a 2019 survey, Deloitte reports that 67% of executives aren’t comfortable accessing or using the data at their organizations. In a separate poll from NewVantage Partners, meanwhile, less than a third of firms identify themselves as being data-driven — despite significant investments in AI and business analytics tools.
According to Michael Amori, the problem often lies in tooling. He’s the co-founder of Virtualitics, a startup developing software to help companies visualize — and gain insights, with any luck — from their data.
“Common dashboard tools fall short of revealing the hidden insights buried in today’s intricate data,” Amori told me in an email interview. “And when bias, privacy and ethics are becoming even more important, having a solid understanding of the data, outliers and patterns, companies can create an environment of responsible usage.”
Virtualitics, launched in 2016, was born out of Caltech and NASA’s Jet Propulsion Lab in Pasadena. A few years ago, Amori was introduced to George Djorgovski, a professor of astronomy and data science at Caltech, and Ciro Donalek, a computational staff scientist at Caltech’s Center for Data-Driven Discovery, which Djorgovski was heading at the time.
“Donalek’s expertise in AI, particularly in aiding Caltech astronomers with big data analysis, and his work in creating collaborative virtual spaces converged,” Amori said. “Virtualitics was born from this, focusing on three-dimensional visualizations to elevate data analysis beyond traditional methods.”
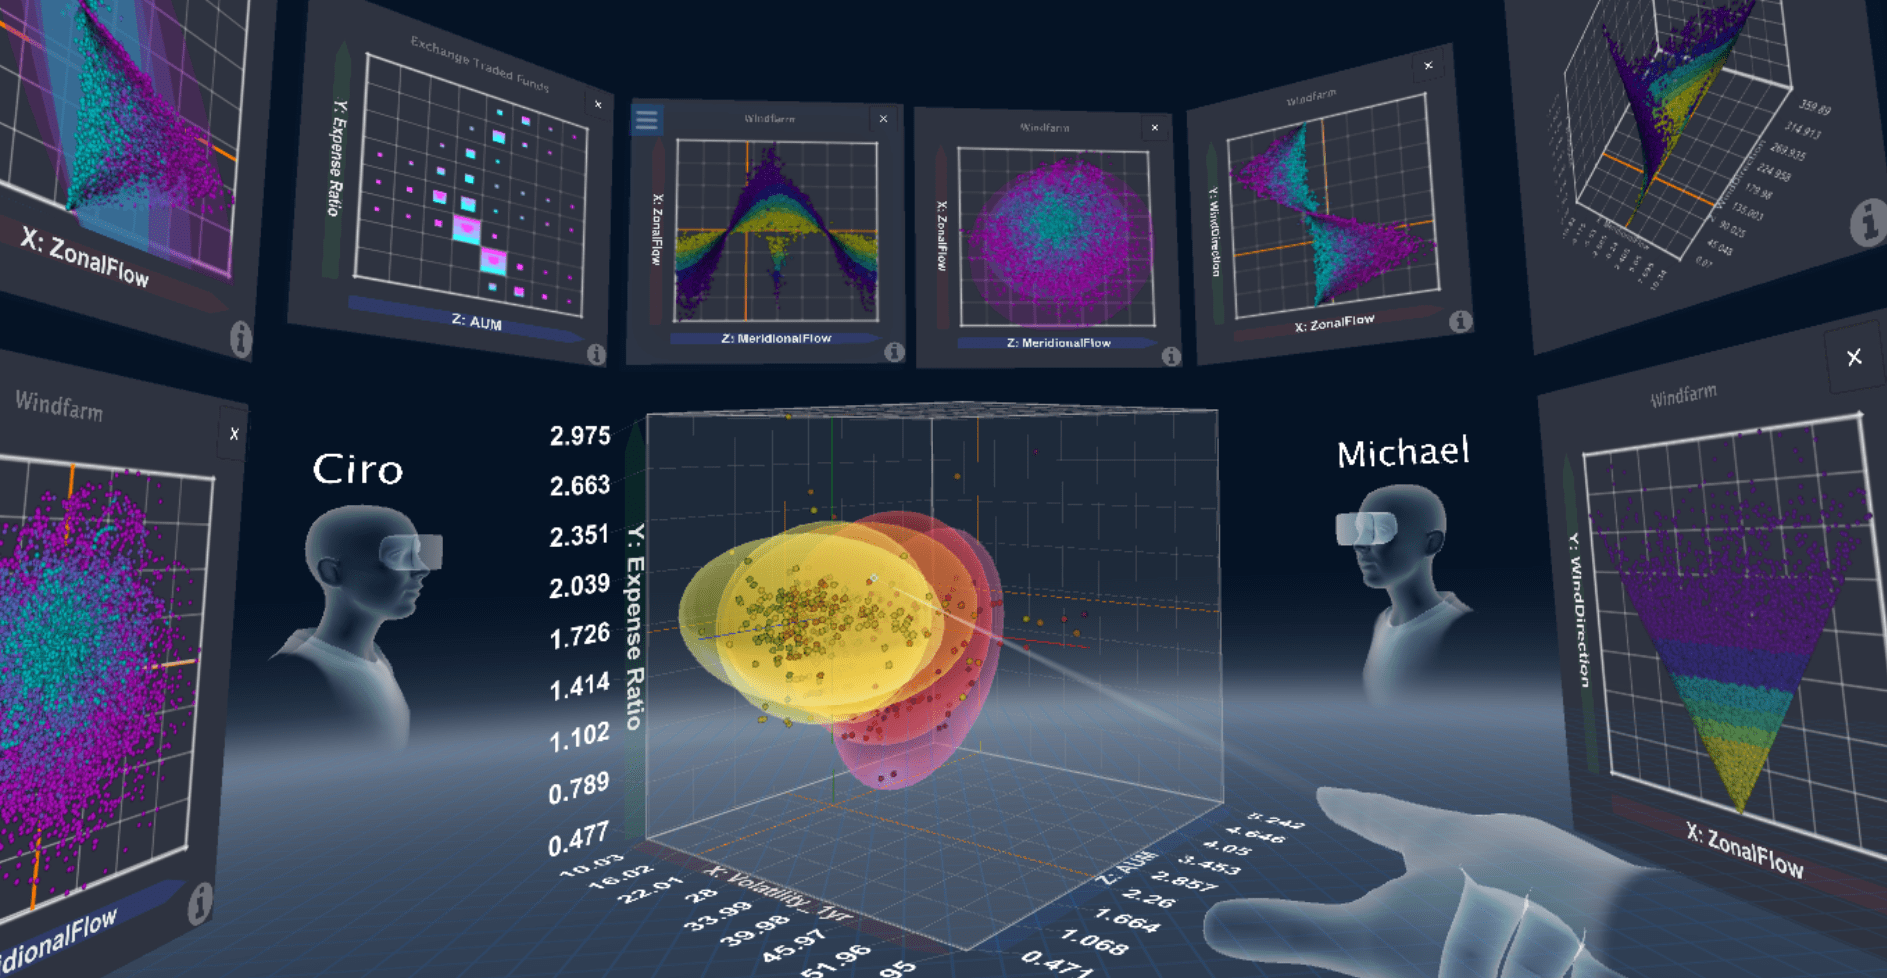
At a high level, Virtualitics uses 3D visualizations, knowledge graphs and AI to expose the relationships between different points of data. Given a data set (or several), optionally along with a question in plain English (e.g. “What drives credit card skimming?”), the platform can generate annotations and explanations, which can then be embedded in reports and dashboards and shared with stakeholders across an organization.
A customer in the financial industry could, for example, use Virtualitics to spot patterns of payment and wire fraud. Or a marketing company could leverage the platform to identify emerging customer segments and the marketing channels most likely to perform best.
But plenty of business intelligence tools visualize data, including Bayes, which Airtable acquired in 2021, and London-based, Canva-owned Flourish.
So what makes Virtualitics different? Its data visualizations can be viewed in VR and AR, for one. But Amori argues the platform’s also simpler to use and more powerful than most solutions on the market — and, perhaps most important of all, doesn’t require deep technical expertise.

Virtualitics’ 3D-centric data visualization platform.
“Traditional data exploration tools have limited capabilities in identifying and visualizing the complexity of today’s data,” he said. “Also, traditional analytic techniques and dashboards fall short in providing visually intuitive outputs, making it hard to truly understand what the findings mean or predict what lies ahead. All of this is combined with the fact that humans approach a data set already with a bias, a preconceived notion of what might be going on in the data and then they explore the data to see if their hypothesis was correct.”
The jury’s out on all that. But it’s certainly true that companies often struggle to drive internal use of whatever business intelligence software they’ve invested in.
In a 2020 business intelligence survey from 360Suite, companies said that the main challenges they face are managing user adoption and data quality control. Cost control and security were cited as the other major blockers in achieving data analytics goals.
“While Virtualitics may occasionally find itself categorized alongside business intelligence tools, our approach is substantially different,” Amori said. “Traditional business intelligence tools are built to ‘report the news,’ with the aim of making data more accessible through simple dashboard reports.”
In a testament to Virtualitics’ success — or at least the strength of its marketing efforts — the company’s year-over-year revenue has increased 370%. Amori credits Virtualitics’ recently acquired government sector customers, which include the Department of Defense, with the growth.
“Virtualitics has partnered with the defense and national security community since 2017 on projects ranging from operational readiness, investment analysis and mission support and intelligence analysis, among others,” Amori said, noting that Virtualitics recently appointed a retired U.S. Army General, John Murray, and former U.S. Navy Vice Admiral, Timothy White, to its advisory board.
Gearing up for the next phase of expansion, Virtualitics today announced that it raised $37 million in a Series C funding round led by Smith Point Capital with participation from Citi and advisory clients of The Hillman Company. Bringing the startup’s total raised to $67 million, Amori says that the new cash will be put toward collaborations, customer success efforts and expanding Virtualitics’ headcount (which currently stands at 76 people).
“The motivation behind raising a Series C funding round was driven by two key factors,” Amori said. “First, our company has a strong track record of successfully collaborating with the Department of Defense on mission-critical programs, and this aspect of our business continues to experience significant growth and expansion. However, we also recognize the increasing demand for AI-driven analysis within the enterprise sector, as data size and complexity continue to grow exponentially. With the new funding, we will be able to accelerate our roadmap, integrating more AI and specifically generative AI technology into our platform, and further scaling our business to meet the evolving needs of our customers and the market.”


